Mobile Lab (aka Labtop)
Introduction
This summer, I’m in Virginia for an internship at FireEye. I’m staying in an extended stay hotel, which is nice, but unfortunately I was unable to haul all my servers across the country (I’m sure TSA would’ve loved it, though.) Since I’m unable to have my full lab running in Oregon while I’m gone, I’ve had to get creative with labbing things in Virginia. The only tech I was able to bring was some (compact) Ubiquiti networking gear, my Macbook, my Thinkpad, and my Nintendo Switch. Even though I can’t have the full homelab experience on the road, I still wanted to experiment with things (namely, the new Elastic Stack SIEM), so I set out to stand up a mobile lab enviornment on my newly dubbed “labtop” (trademark pending).
The solution I’ve deployed isn’t perfect or super clean, but it gets the job done. I had a few goals in mind when putting this system together:
- It needs to be secure, both for the host and the VMs. I’m planning on taking this labtop to DEFCON later this summer, and in the event of me needing to check my email or respond to something at work, I need a secure way to do that.
- It needs to be functional. My Thinkpad is a T450, with a 2c/4t Intel processor, 16GB of RAM, and a 250GB SSD. Not ideal specs, but I could make it work. I also wanted it to remain functional as a daily driver without any VMs running.
- It needs to allow for rapid iteration. I don’t want it to take a couple hours just to spin up a new VM and get networking configured, so a system that combines security with speed is a necessity.
- It needs to be robust and redundant wherever practical. Obviously I can’t have redundant uplinks or hosts on a single laptop, but I can design overlapping protections that help pick up the slack in case something stops working or I make a mistake along the line.
Diagram
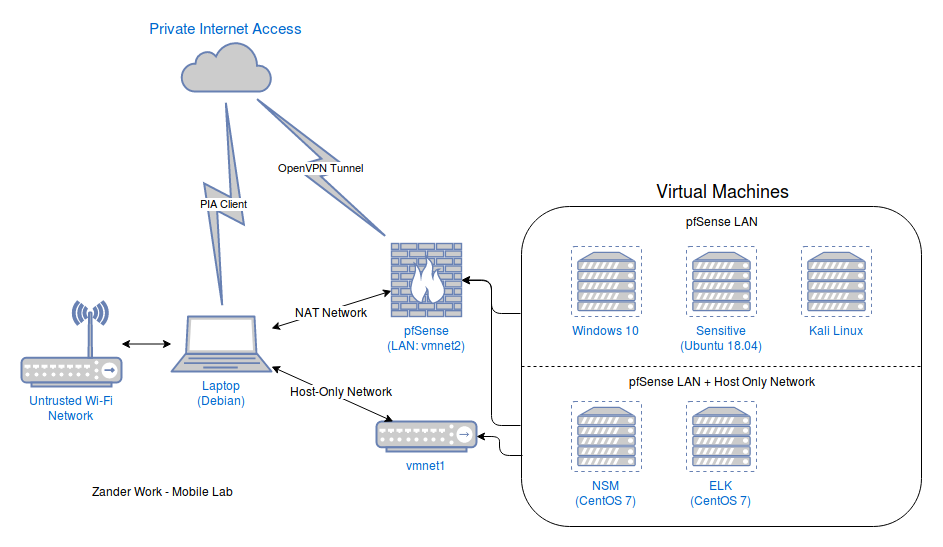
With that in mind, here is a diagram of what I ended up with (I’m not the best at diagrams, so there’s a detailed description below):
Host Protections
As previously mentioned, the host is a Lenovo Thinkpad T450, running Debian 9, and I’m using VMware Workstation 15 for my hypervisor. Both the hotel network and the WiFi at and around DEFCON are (very) untrusted, so using a VPN is a must. I’ve been a happy Private Internet Access (PIA) customer for years, and use it on all of my devices. Their Linux client is quite good (it’s essentially a glorified GUI running on top of OpenVPN), and has some nice features such as a VPN Kill Switch (if the tunnel drops, all network traffic gets blocked until it’s restored) that you can tweak. I’ve configured PIA to autoconnect on launch, and it does a very good job connecting as soon as my WiFi connection comes up (FYI, networks with captive portals can make this a bit of a pain).
For network protections on the host, I’m using iptables to protect against any attempted inbound connections. I’d like to have a deny all outbound rule with exceptions, but that’d require a lot of work and isn’t super practical, so a deny all inbound/allow all outbound is what I settled with. I have Docker installed on the host system in case I need to spin up an ad hoc container for something, and it, along with PIA, modifies the iptables rules when they are run, so I’ve added additional rules to the FORWARD chain to drop all inbound connections heading towards a Docker container in case I make a mistake somewhere else. I’ve also set the Docker daemon to not run at boot, so in case there’s an issue with the firewall rules, the threat size is much smaller, as I have to go out of my way to create a potential hole.
Virtual Network
I’m using pfSense as the border network device for all of the VMs. I’m a big fan of pfSense, and use it as the border gateway/firewall in my main homelab, so I knew I wanted to use it here. One of the great features of pfSense is that it can act as an OpenVPN client, and NAT/tunnel your LAN traffic through the VPN connection, and PIA has a great article on their website for configuring this. If the VPN tunnel goes down, all outbound network communication stops, which is perfect for this system. I have the pfSense VM configured with the following interfaces:
- Int 1: NAT. This is the “WAN” interface, and goes through the VMware network stack and out my existing network connection on the host.
- Int 2: vmnet2. This is the “LAN” interace, and all of the VMs have an interface on this network as well. pfSense is serving DHCP on this network, so any host will get an IP and be able to connect out through the PIA tunnel with no hassle.
Virtual Machines
In addition to my pfSense VM, I have 5 other virtual machines running on the system:
- Windows 10: I believe that it’s always a good idea to keep a Windows VM on hand, because the second you don’t have one, someone’s going to give you a PE64 that won’t work in Wine and is (apparently) “mission critical”. This may become a FLARE VM in the future, but for now it’s just a clean Windows 10 install with Firefox, Sublime Text, the new shiny Windows Terminal, and Winlogbeat (see ELK/Elastic Stack below). Also, if I happen to get a Windows binary during a CTF, it’s much easier to just use Windows.
- Kali: Again, same point as above. Although most of my CTF tools are configured on my host Debian install, better safe than sorry. Plus, if I ever have the hankering to pwn some (HackThe)Boxes, I’ve got my tools ready to go.
- Sensitive: This is a VM running Ubuntu 18.04 that was a later addition to the plan. Before I learned I was going to DEFCON, I had my password manager installed on the host Debian install, and was checking my email and performing other sensitive tasks on the host OS. However, if I’m taking this labtop to DEFCON, I’d prefer to have another layer of defense between a rogue actor on the network and my banking information, so I setup an Ubuntu VM with Full Disk Encryption (FDE) that I use to check email and other equally exhilirating tasks. I’m not sure if the benefits of FDE are as strong in a VM as they are on a physical machine, but the risk outweighed the effort to set it up, so why not. When I’m finished with whatever task I was doing, I have a powered-down snapshot that the VM automatically reverts to, which helps protect any information that may have been transferred to the VM.
- ELK: As mentioned above, one of the main reasons I set out on this adventure was to test out the new SIEM capability that was recently introduced into the Elastic Stack. This VM is running CentOS 7, and has Elasticsearch, Kibana, Logstash, and Filebeat running on it (more details later on.)
- NSM: I love network security, so obviously my first data collector for the Elastic Stack SIEM was going to be Zeek (formerly Bro). I’ve been using Zeek for nearly two years now, and it’s a fantastic network security monitoring platform. This VM is running Centos7, and has Zeek inspecting all traffic on the pfSense LAN network, and is shipping its logs to Elasticsearch via Filebeat.
The ELK and NSM VMs also have a second NIC that goes to a host-only network running on vmnet1. This allows me to SSH from my host OS into the VMs so that I don’t have to work in the VMware Workstation console view. I can also utilize this to view the Kibana dashboard from my host OS as well, which is nice.
Zeek
I’m using a fairly stock Zeek configuration on this setup. The installation instructions here are great, but here are a few things I did in addition:
- I cloned from GitHub to get the latest code (
git clone --recursive https://www.github.com/zeek/zeek.git). The most notable change is that binaries and file paths/extensions have been changed to Zeek, and the latest stable release (at time of writing, 2.6.2) still uses the Bro nomenclature. - I configured Zeek to output JSON logs with ISO8601 timestamps (add this to
$PREFIX/share/zeek/site/local.zeek):
@load tuning/json-logs
redef LogAscii::json_timestamps = JSON::TS_ISO8601;
redef LogAscii::use_json = T;
- I also have Zeek running as the
zeekuser, rather than root. The major issue with this is getting permissions to sniff on the NIC. Zeek uses thesetcaputility for this, and I’m using this Zeek plugin to enable the setcap permissions correctly. This still needs to be tweaked, becausezeekctl installsays that the setcap operation failed, but it actually gets set properly, so YMMV.
That’s pretty much it for Zeek so far. I want to install JA3 and HASSH at some point and play with some custom scripts, but I haven’t gotten to that yet.
Promiscuous Mode
Promiscuous mode is a mode of operation on a NIC where traffic for all hosts on the network is accepted, and not just traffic destined for that specific NIC. When running tools such as Wireshark or Zeek, the NIC has to be in promiscuous mode, otherwise you’re just going to see traffic from your NSM box. When you try to do this on a VMware Workstation VM, you get the following message:
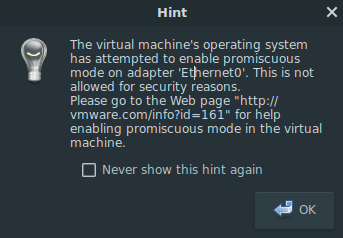
The solution to this is to set the permissions on the vmnet device to allow your current user to read/write the device. I did this by making a group called nic-prom, adding myself to it, and making nic-prom the group owner on the NIC. Then, you can add group read/write permissions to the device to make it promiscuous-able:
$ sudo groupadd nic-prom
$ sudo usermod -a -G nic-prom zander
$ sudo chown :nic-prom /dev/vnmet1 # or whatever vmnet you want
$ sudo chmod g+rw /dev/vmnet1
Note: If you want to do promiscuous on a LAN Segment or the default Bridged Network, you need to set the permissions on /dev/vmnet0. If you want to do it on the default NAT Network, set it on /dev/vmnet8. If you want to do it on the default Host-Only Network, set it on /dev/vmnet1.
However, this doesn’t persist across reboot, so I made this addition to the end of the vmwareStartVmnet() function in /etc/init.d/vmware:
for int in /dev/vmnet1 /dev/vmnet2 /dev/vmnet3 /dev/vmnet8; do
    chgrp nic-prom $int
    chmod g+rw $int
done
When VMware starts up at boot, it will run that loop when it initializes networking, thus setting our permissions and allowing promiscuous mode.
Elastic Stack
The main attraction of this lab is the Elastic Stack deployment. I still have a lot to configure and tune in the future, but so far so good.
Data Collection (Beats)
Currently I have two Beats collecting data. I’m using Filebeat on the NSM system for my Zeek Logs, and Winlogbeat on the Windows 10 system to forward event logs. Elastic has done a great job at making these super simple to configure, and all you have to do is tell them where the logs are, and where to send them (you can do more complex operations with Pipelines or forwarding to Logstash for processing, but it’s not required).
Zeek
Filebeat has a module for Zeek, which is fantastic. Once it’s installed, all you have to do is:
$ sudo filebeat modules zeek enable
Enabled zeek
Edit the Zeek module config file (/etc/filebeat/modules.d/zeek.yml) to specify the path for each log file:
- module: zeek
  connection:
    enabled: true
    var.paths: ["/usr/local/zeek/logs/current/conn.log"]
  # repeat for other logs
Edit the main config file (/etc/filebeat/filebeat.yml) to specify information about the beat (optional) and the IP/port for Elasticsearch and Kibana, along with authentication information (if necessary):
# snip
name: zeek-beat
tags: ["zeek"]
# snip
setup.kibana:
  host: "$ELK_IP_HERE:5601"
# snip
output.elasticsearch:
  hosts: ["$ELK_IP_HERE:9200"]
# snip
Windows Event Log
Winlogbeat’s out of the box config is perfect for what I needed, so I just had to set the Elasticsearch/Kibana info in the config file (C:\Program Files\Winlogbeat\winlogbeat.yml):
# snip
name: windows-logs
tags: ["windows"]
# snip
setup.kibana:
  host: "$ELK_IP_HERE:5601"
# snip
output.elasticsearch:
  hosts: ["$ELK_IP_HERE:9200"]
# snip
Elasticsearch
Elasticsearch had a few things to be configured. I needed to set the name of the host and cluster, and tell Elasticsearch about the cluster config so that it knows how to elect a “master node”. Since there’s only one node, it’s a pretty trivial config. For the time being, I don’t have any authentication configured, but in the future I’ll be configuring that as well. Here’s my changes to the Elasticsearch config (/etc/elasticsearch/elasticsearch.yml):
cluster.name: zw-mobile
node.name: prod-data-1
# snip
network.host: $ELK_IP_HERE
# snip
discovery.seed_hosts: ["$ELK_IP_HERE"]
cluster.initial_master_nodes: ["prod-data-1"]
Kibana
Kibana was fairly trivial to configure as well, just needed to set names and IP addresses.
server.host: "0.0.0.0"
# snip
server.name: "zw-mobile"
elasticsearch.hosts: ["http://$ELK_IP_HERE:9200"]
I’m binding to 0.0.0.0 so that I can access Kibana via the host-only network while still allowing other VMs on the pfSense LAN to access it as well.
Also, there is the most important configuration change in the whole setup right here: Kibana Dark Mode. In the web UI, go to Management -> Advanced Settings, search for Dark Mode, and flip the switch. May your eyes rest easy.
Usage
Kibana has a great Zeek dashboard that pulls out lots of nice stats for us to look at for a high-level overview of our network. It has a map with GeoIP data, information about top hosts and applications, and more:
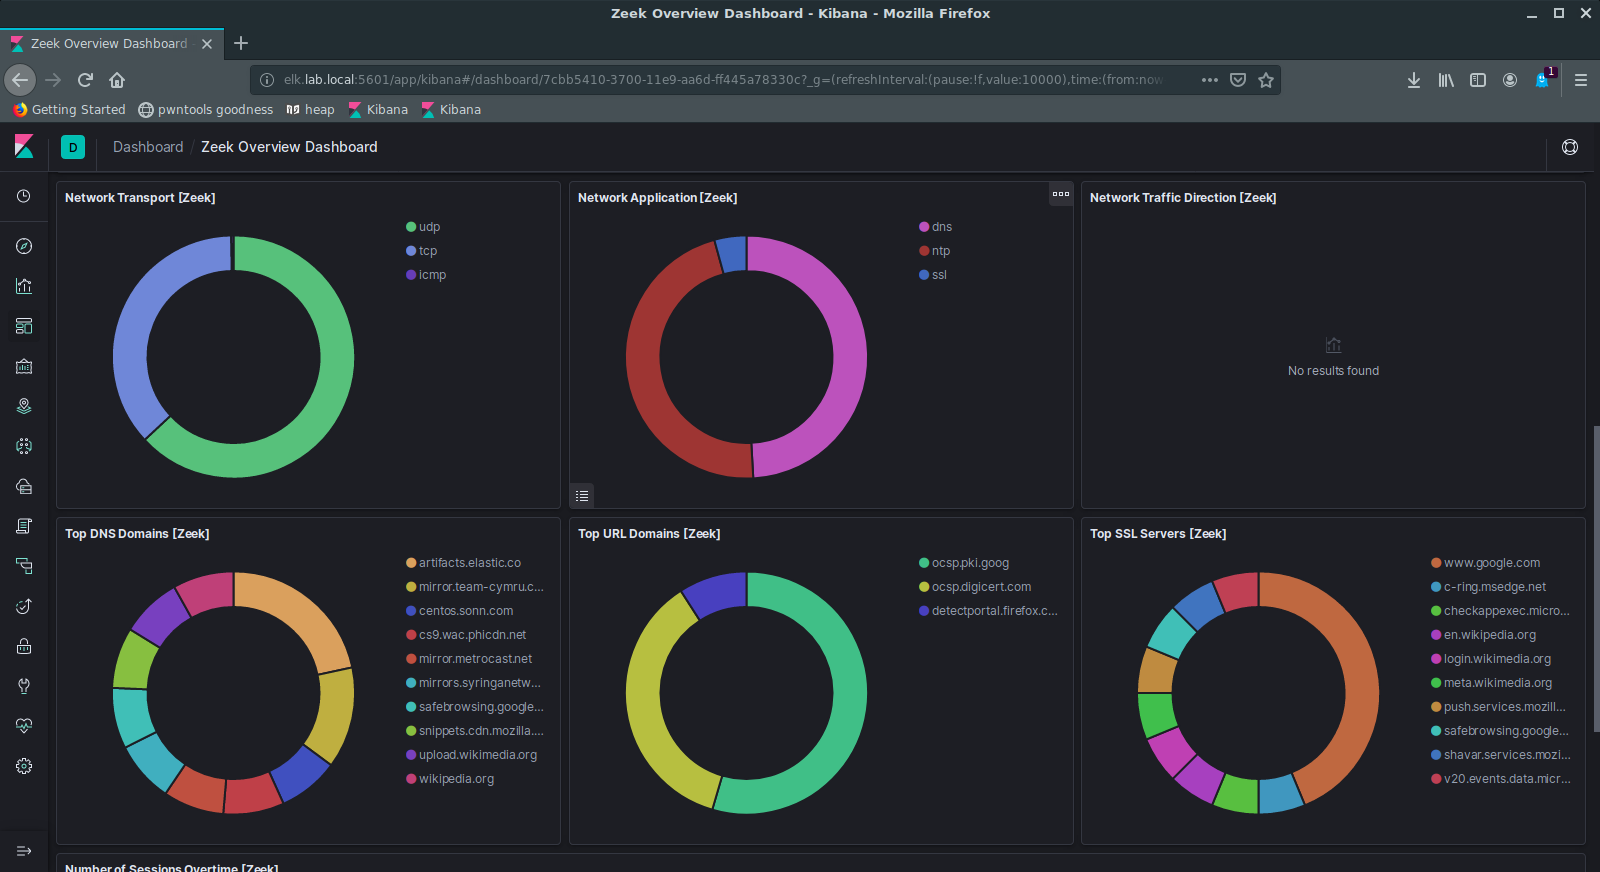
Kibana 7 also uses the new Kibana Query Language (KQL) by default instead of Lucene, so you can use that to query the data. There’s also a dev section where you can run raw queries against the Elasticsearch nodes.
At this point, I’m still working on getting log ingestion tuned to the point where I can start using the SIEM part of Kibana, so I’ll try and do another blog post on that in the future once I have more to show on it. My initial impressions is that it looks awesome, and integrates very nicely with the Filebeat module ecosystem.
Things to Improve On
I definitely want to do a v2.0 of this system. Having a mobile lab environment could definitely be helpful in the future, and there are a number of things I want to improve on, either as changes for the current system, or things to be integrated in the new one:
- Add more Beat data collectors throughout the environment to ship more data back to Elasticsearch
- Use Ansible to automate new VM deployment even more. I learned how to use Ansible earlier this year putting together the OSUSEC WiFi Security Demo, and this would be a great application to continue practicing those skills.
- Instead of dual-homing some of the VMs, setup an OpenVPN server on the pfSense VM as well, and VPN into from the host system. This would enable me to have more granular network controls in the virtual network, and would be more similar to a real-world environment
- Segregated virtual networks, either with multiple vmnets or VLANs
- Currently, the host system has all of its network traffic funneled through PIA. Unfortunately, this also includes the PIA tunnel from the pfSense VM, so there is a PIA-in-PIA situation going on. I’m not sure how much this is affecting peformance, or the best way to remedy this, but I want to explore a better way to do this.
- I want to explore using other network security products such as Snort or Suricata on the NSM system, and ship those logs back to Elasticsearch as well.
- I also want to explore Splunk and/or Grafana/Telegram/InfluxDB.
- I’m having issues with GeoIP not working properly, so I need to fix that
- As mentioned previously, I need to setup authentication and SSL for the Elastic Stack
Conclusion
It’s great to have a lab with me wherever I go, and I’m enjoying the flexibility of testing things out on a seperate system. However, I can’t run all of my VMs at the same time, due to CPU and memory constraints. This also mimics a real-world component, resource restrictions (yay for me!). All in all, this has been a great experience and I’ll hopefully have an update in a few weeks with SIEM improvements and more data being ingested.